SECTION 2 DATA STRUCTURE FOR MANIPULATION
In order to process more complex data than one datum internally, data structure is necessary. Unlike the well know data array such SQL (Structured Query Language) as Tabular matrix like CSV (Comma Separated Values), TSV (Tab Separated Values), or such NoSQL (No Structured Query Language) as JSON (JavaScript Object Notation) or graph structure, a data structure should be interactive and computable with its data sets and neighbor or connected data sets as efficient as possible.
Data Processing :
On top of the top down data, the bottom-up data(post processing of google street views) can be map for predicting housing price. This is currently being processed and haven’t being analyzed yet. To process the google street view data, there are two data structures(pixel and graph data structure) where individual data are populated and calculated.Pixel data structure is a matrix, discretizing a urban or district into a finite setting for analysis, in which each pixel has the relationship with its neighbors, and each one computes its own data on the basis of neighbors’ settings, so that urban data can be naturally addressed and computed in spatial context.
Pixel Structure :
Pixel Data structure based on two-dimension matrix array consists of individual pixel which contain diverse data internally. As a parent of each pixel in the hierarchy, the pixel structure governs and controls computing and emerging the new data by processing not only its child pixel but also its neighbors. Just like image processing, the data affect their neighbors based on given algorisms so that the effect of data in the given relationships appear and emerge new pattern of data.
example: data blending in pixel structure
So that individual data can live in the closest pixel and make its relationship with neighbor in the pixels of City of Boston.
Graph Structure :
As a similar technic, Graph data structure could be deployed. Graph structure is mathematical objects that consist of nodes and edges, and are widely used to represent relational data structures. The street network of urban, street, highway or the subway map are examples of objects whose graphs closely resemble their physical form. Thus, the structure will deploy to process urban data in spatial relationships in order to produce features for the house prediction model.

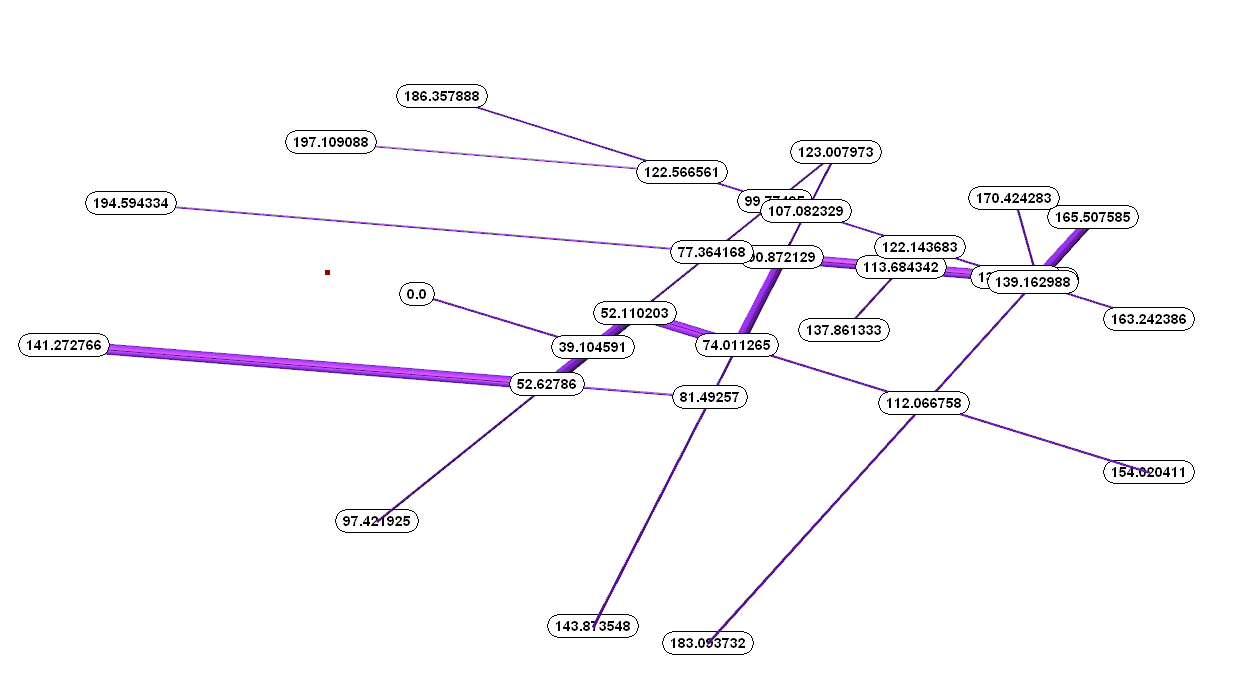
example: Graph interacting with computing data in each nodes, and visualizing its path from a node to a node
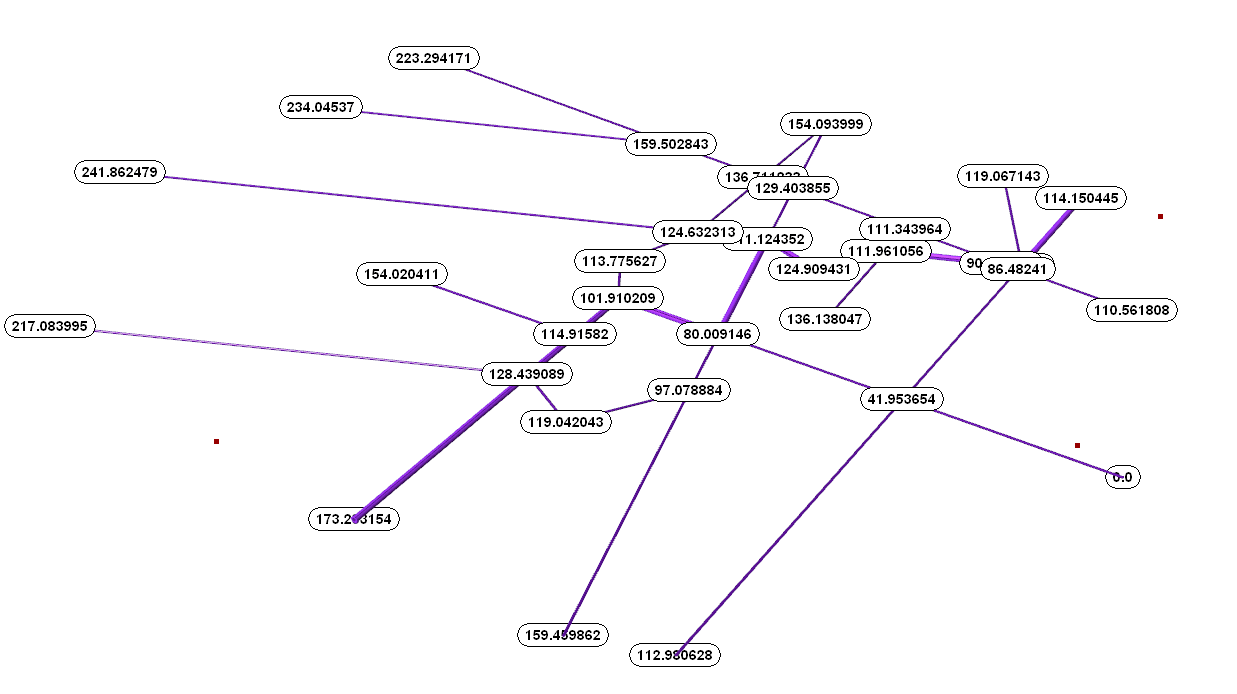
example: Graph interacting with orphan nodes computing internal data based on the change
Thus, Graph makes it possible to deal with the relationship between the Google Place map and each pixel locations, not based on Euclidean distance, but based on Manhattan Distance within roads and street in the Boston, so that it is able to compute the actual distance in the urban context.