Conclusion with data visualization
Section 1 : Validation of assumptions
Price Data Visuzlization
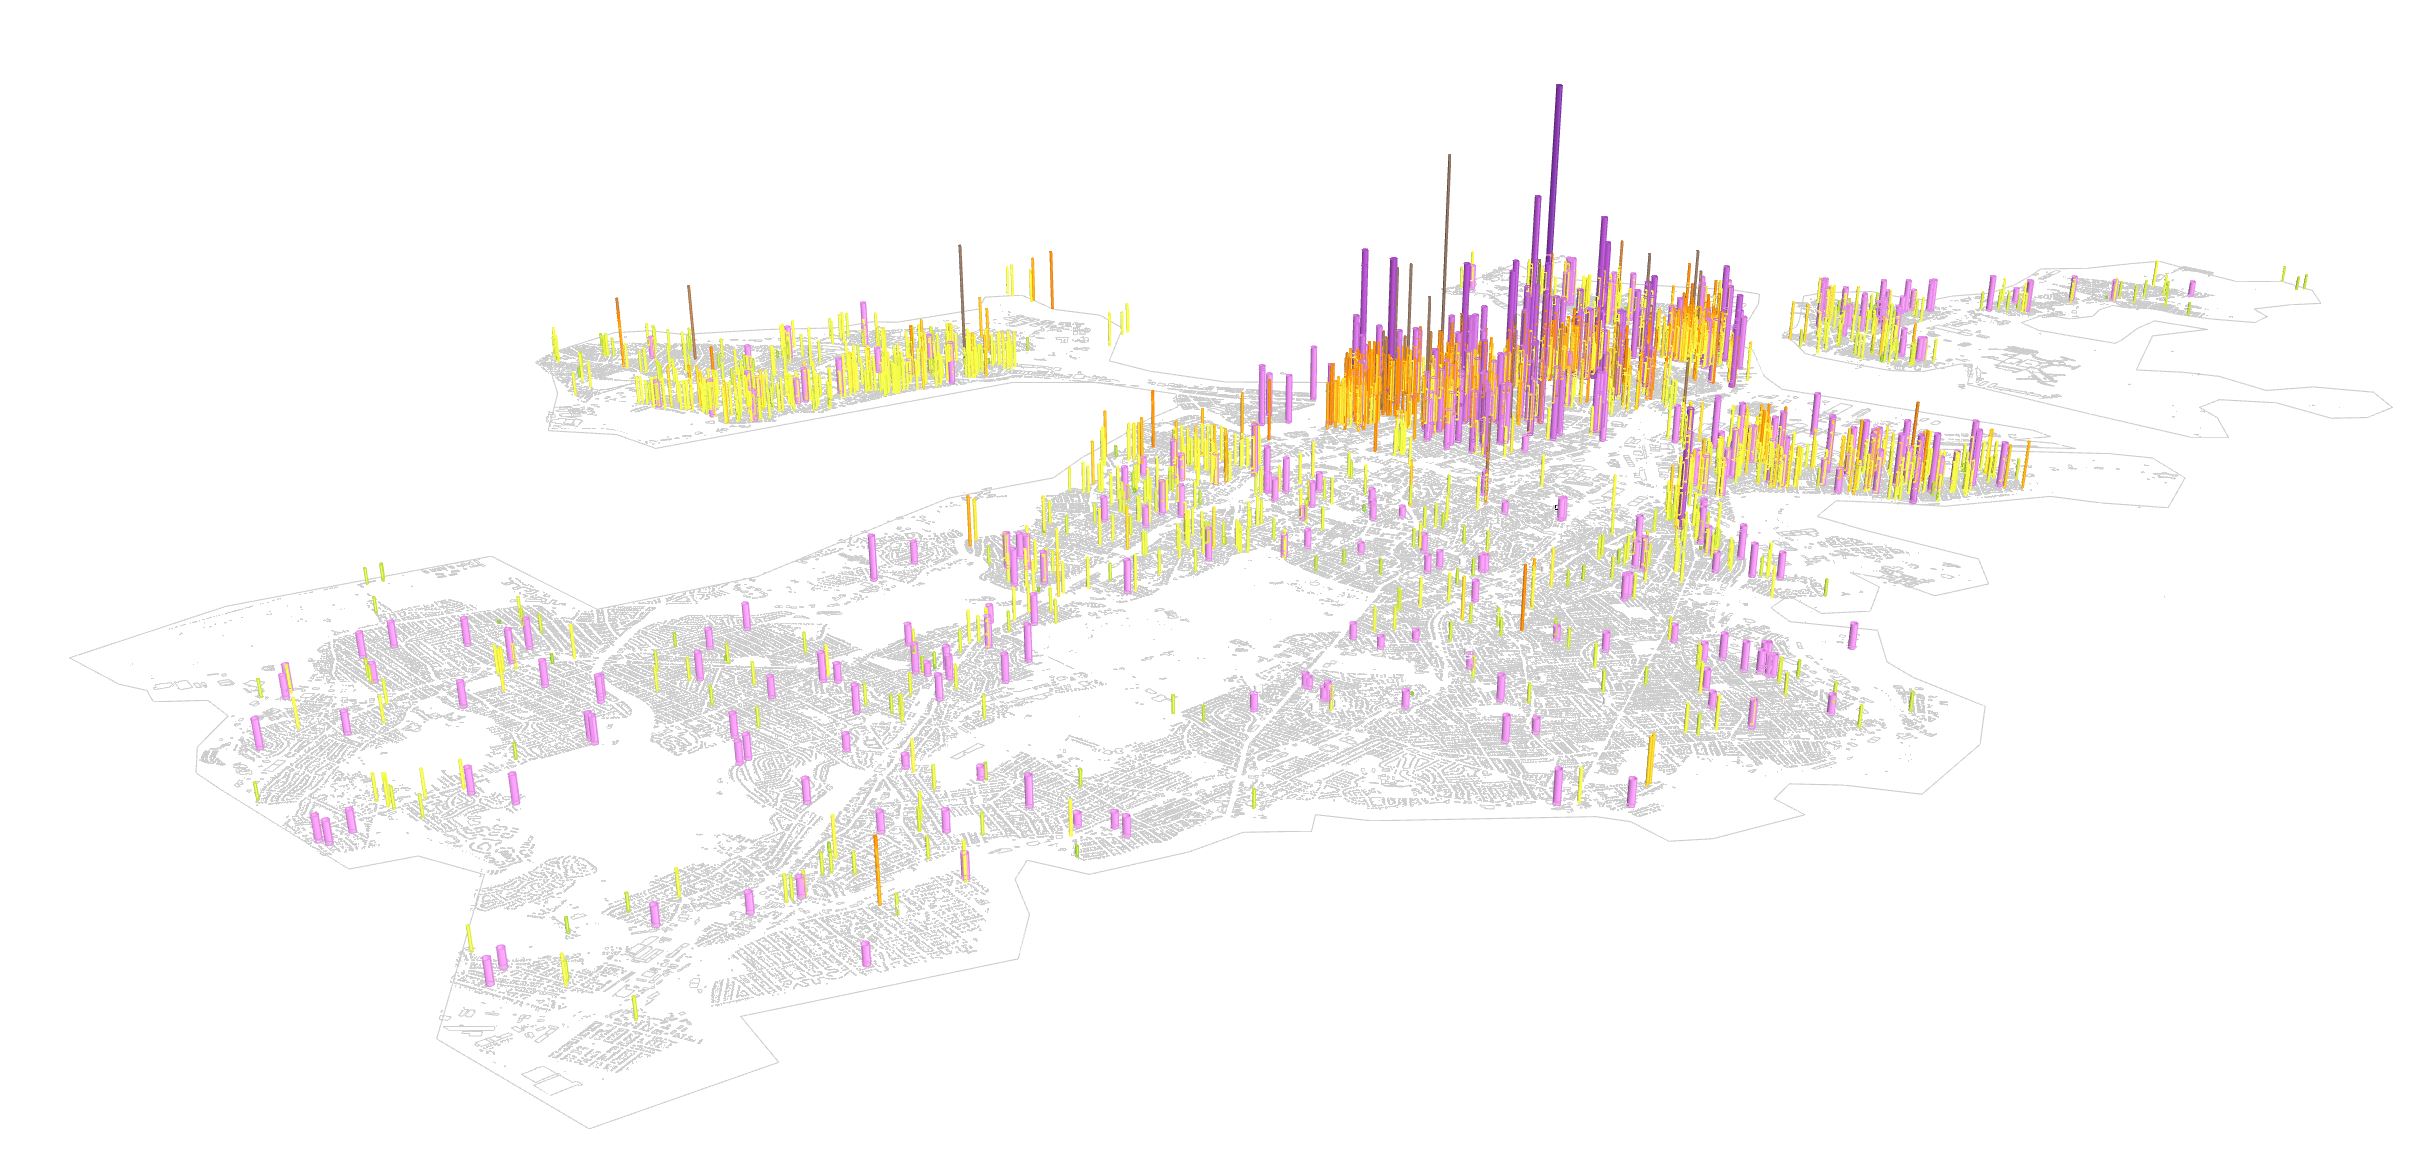
Assumptions
Initially, we assumed that the accessibility to schools and university and MBTA and park affects housing value. However, for rent prediction the walkability to MBTA shows negative relationships for value prediction. To validate our assumptions and results of machine learning, we visualized location of critical factors based on collected raw data. As you can see the figure above, the distribution of important features related to normalized housing and rent prices in most probably positive ways.
Section 2 : Visualization after Machine Learning
Impact of Socio-economic Data
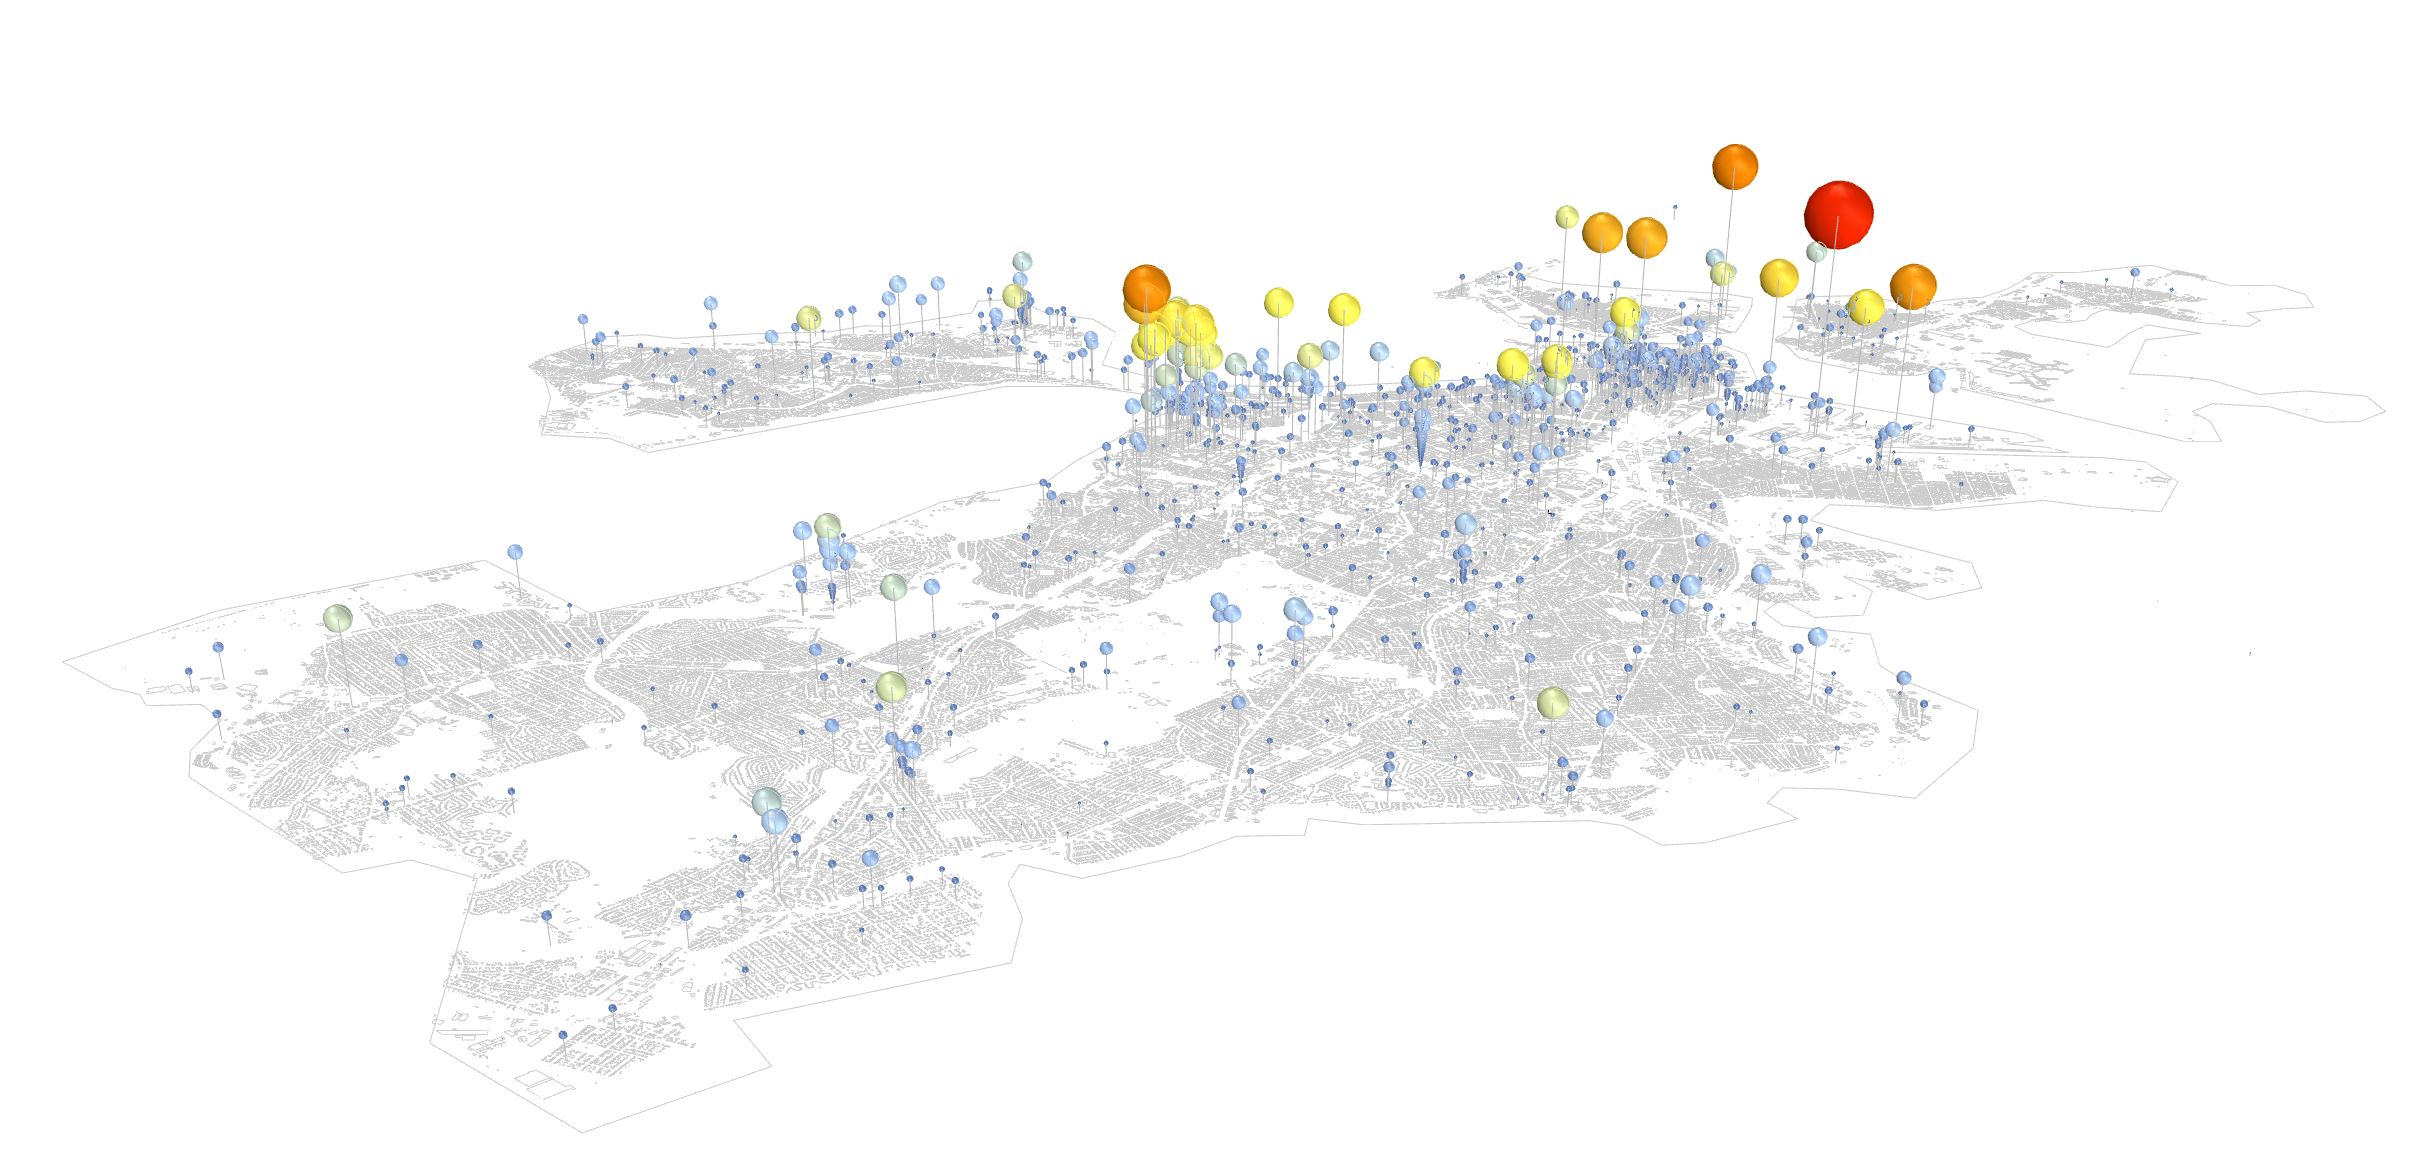
Energy Data : Site EUI of building sectors
Crime Data : Crime rate within boundary areas
On top of the assumptions we made from the social observations, we considered few features as critical factors for building or built environment disclosure. Two of distinctive features are Energy and Crime data. Both are positively correlated with the housing values. Therefore, among multiple features of socio-economic data, we selected site EUI data and crime rate data as final features of the model prediction.
Impact of Visual Data
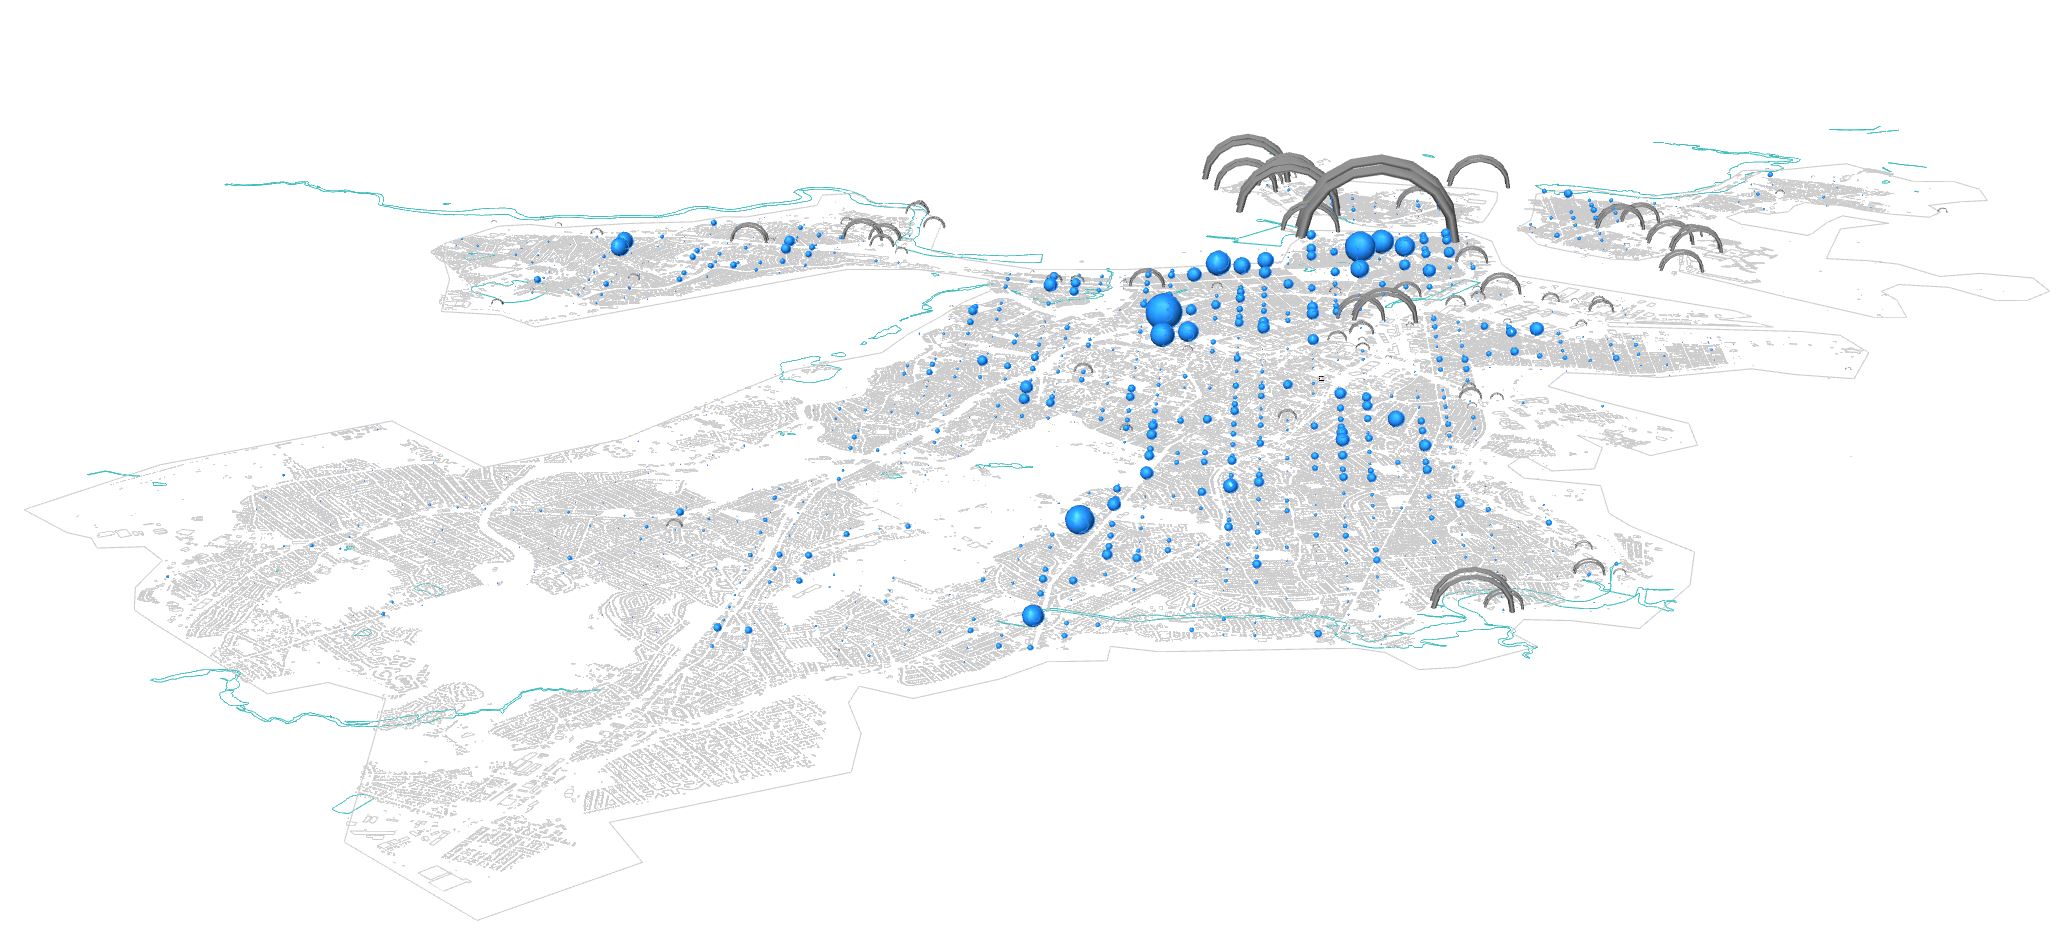
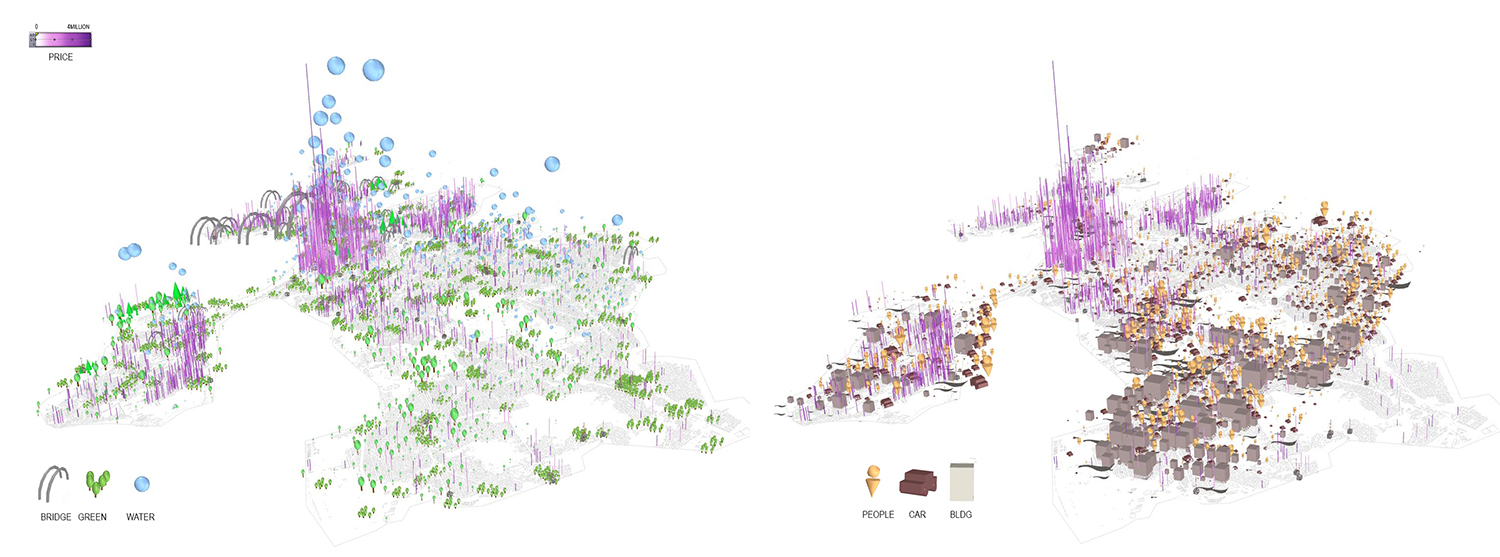
Positive Relationship : Visualized Water and Bridge
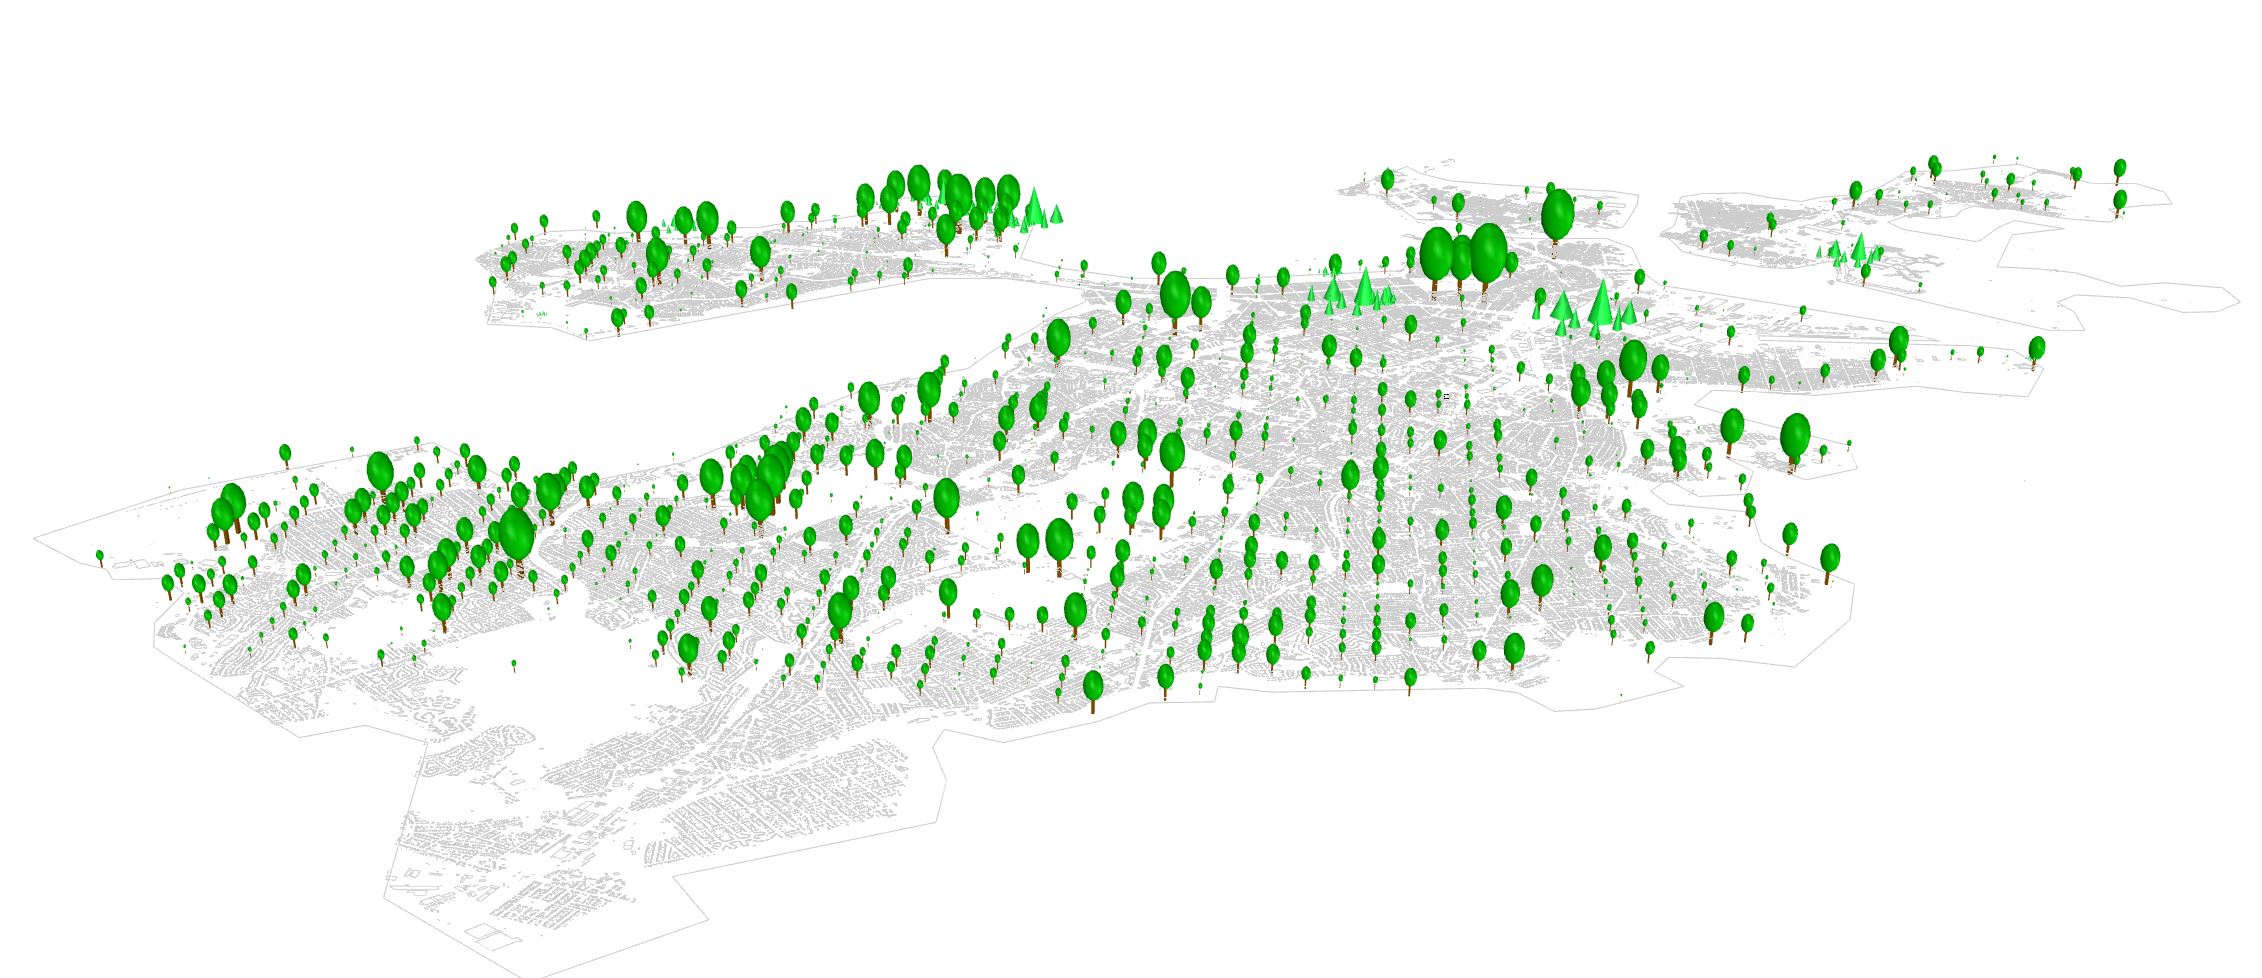
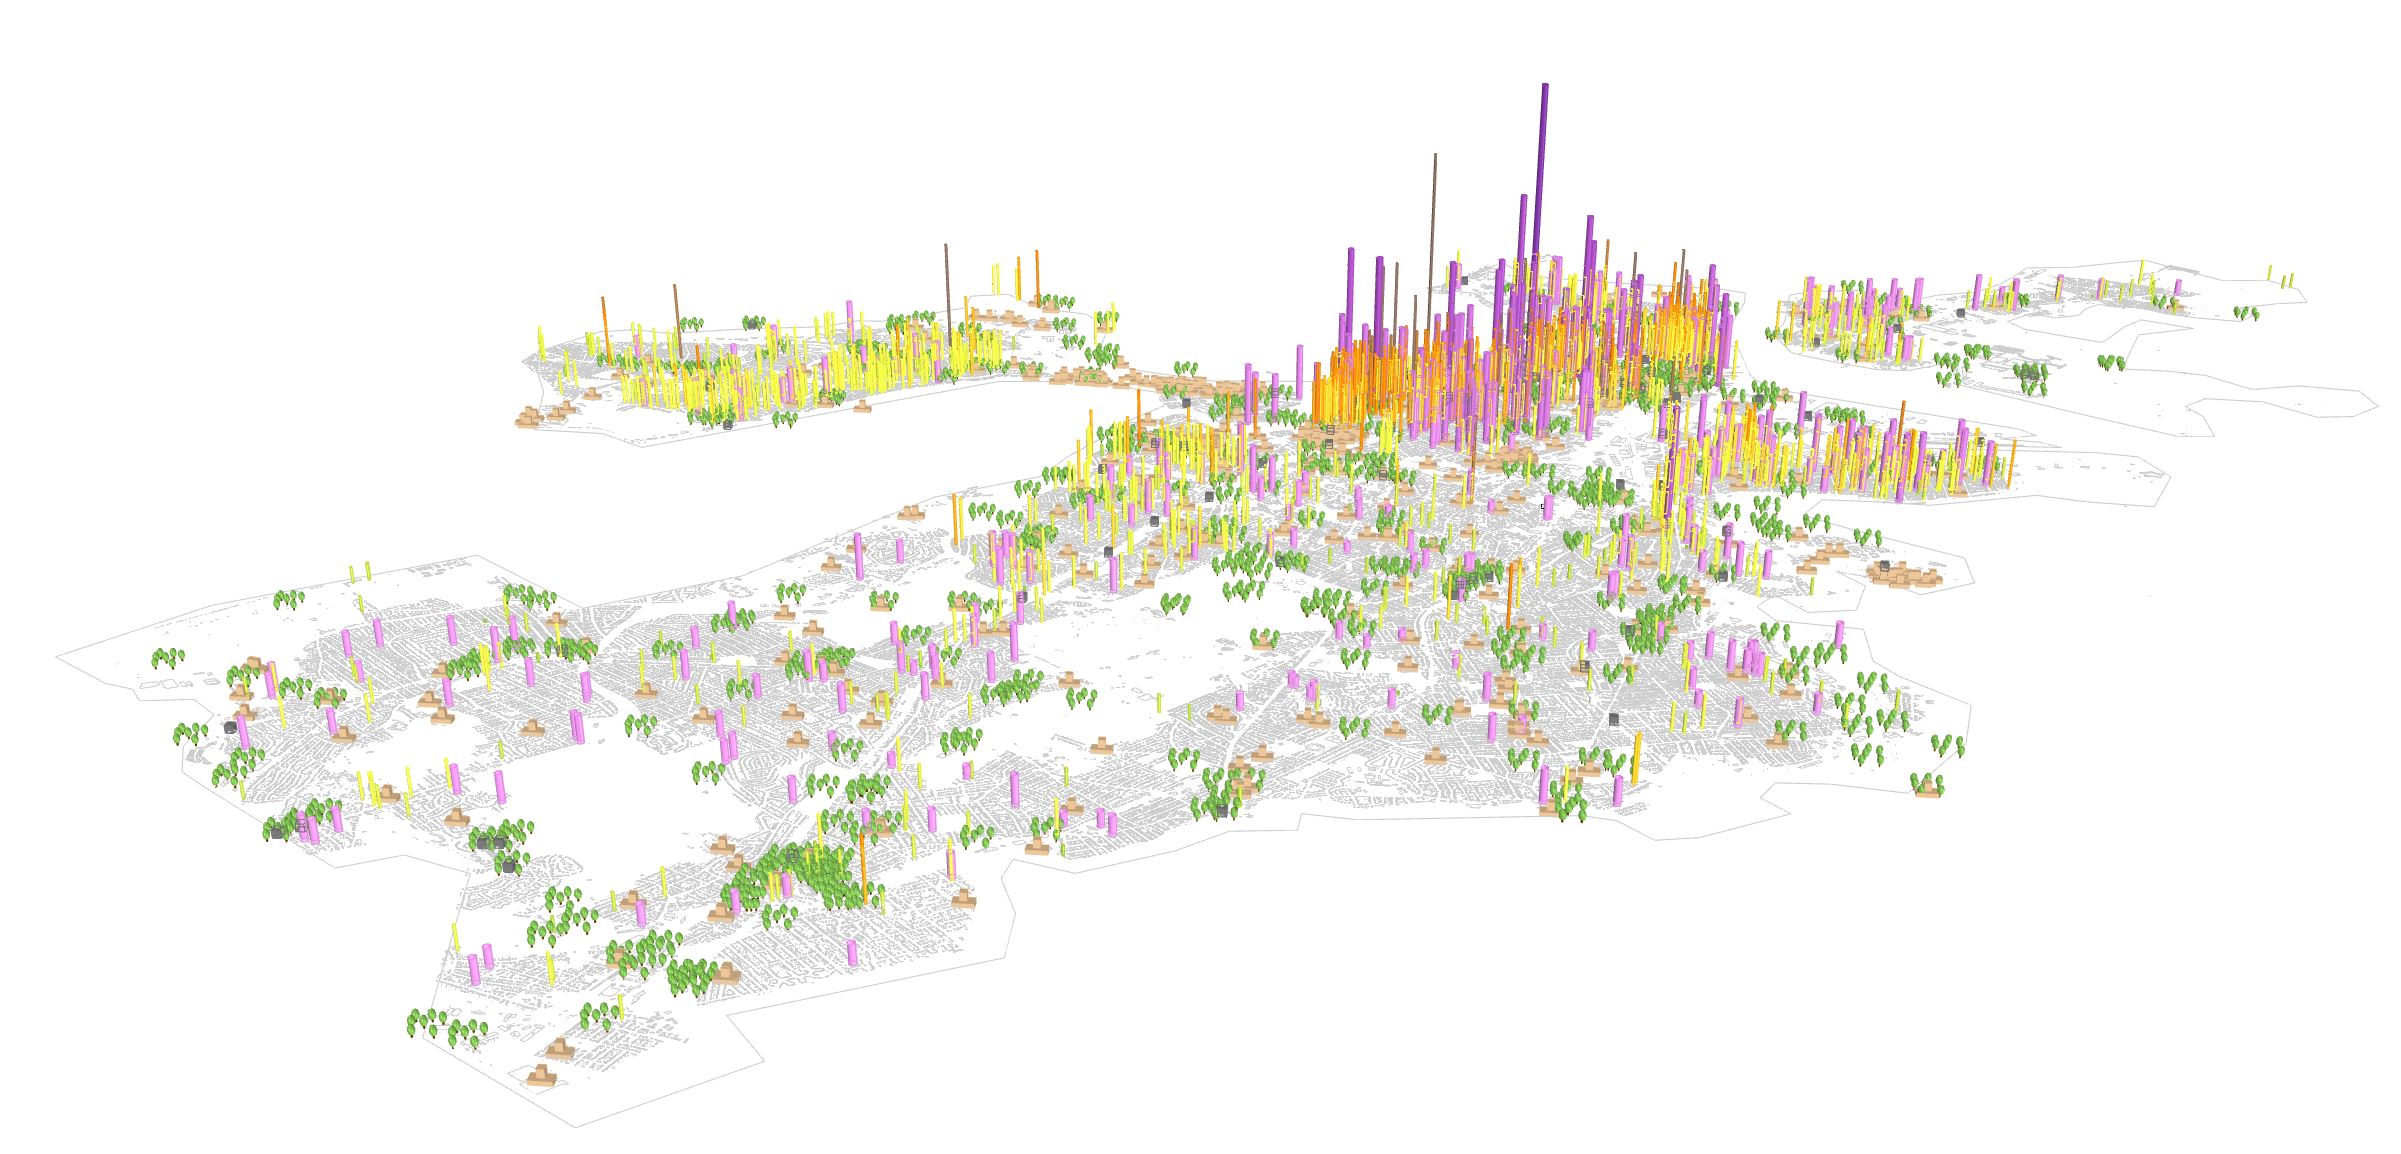
Positive Relationship : Visualized Trees and Grass
There are several critical factors which have an influence on housing value predictions. The positive relationship between visual data and housing value allows us to predict housing values based on the direct relationships. Based on the results of feature selections (cross validation, backward and forward selection and decision trees), it can be conclude that the river (represented as water feature) and bridges near the center of the downtown shows positive relationships. While, we can observe a large amount of cluster of trees in low housing value areas from the figure above, the information of grass and parks(shown in the paragraph above) could be a great indicator to predict housing values and their surroundings.
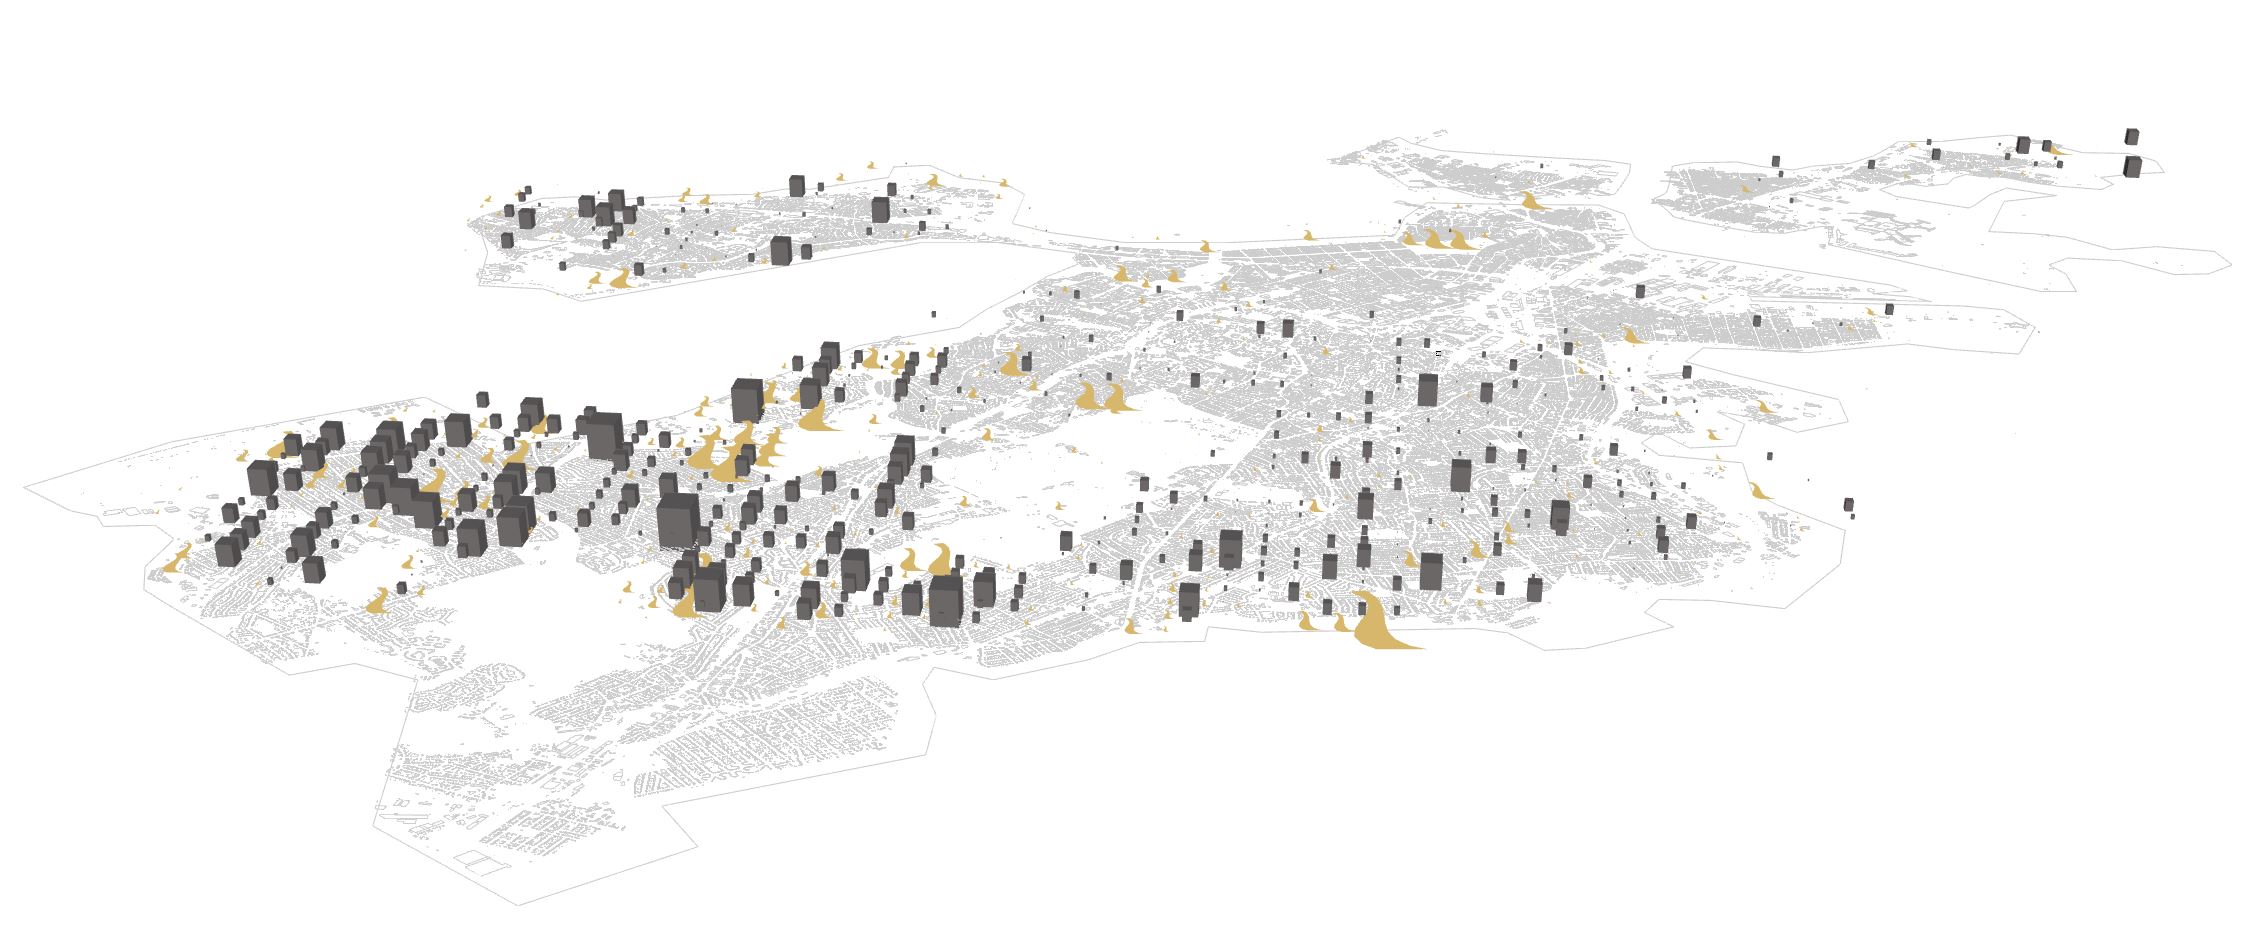
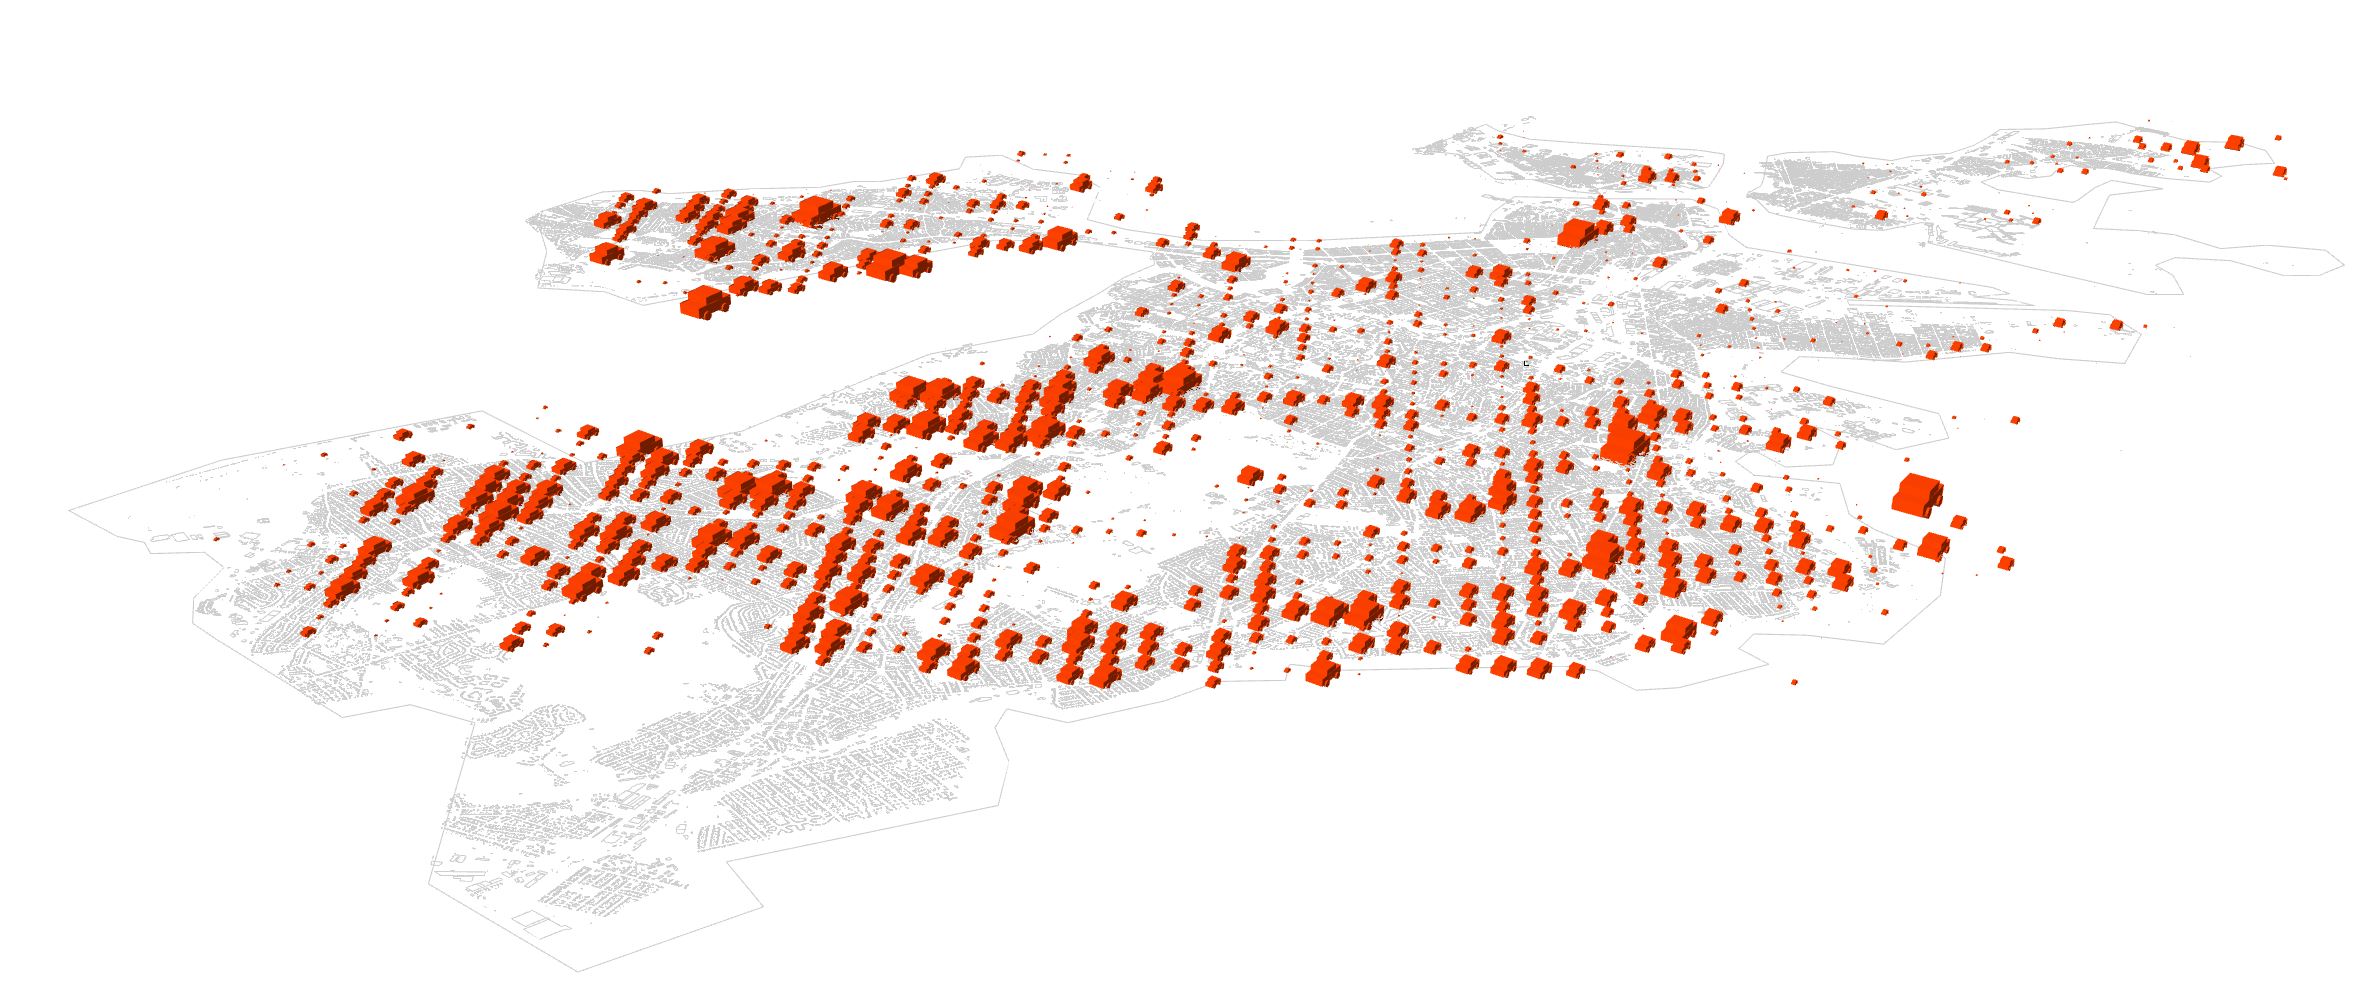
Negative Relationship : Visualized Building and Path
Unlike the previous analysis, features which have negative relationship of housing values could be another indicators to predict housing values and built environment. Especially, the resolution of visualized buildings and path shows the areas where more affordable housing units and rent units are located.
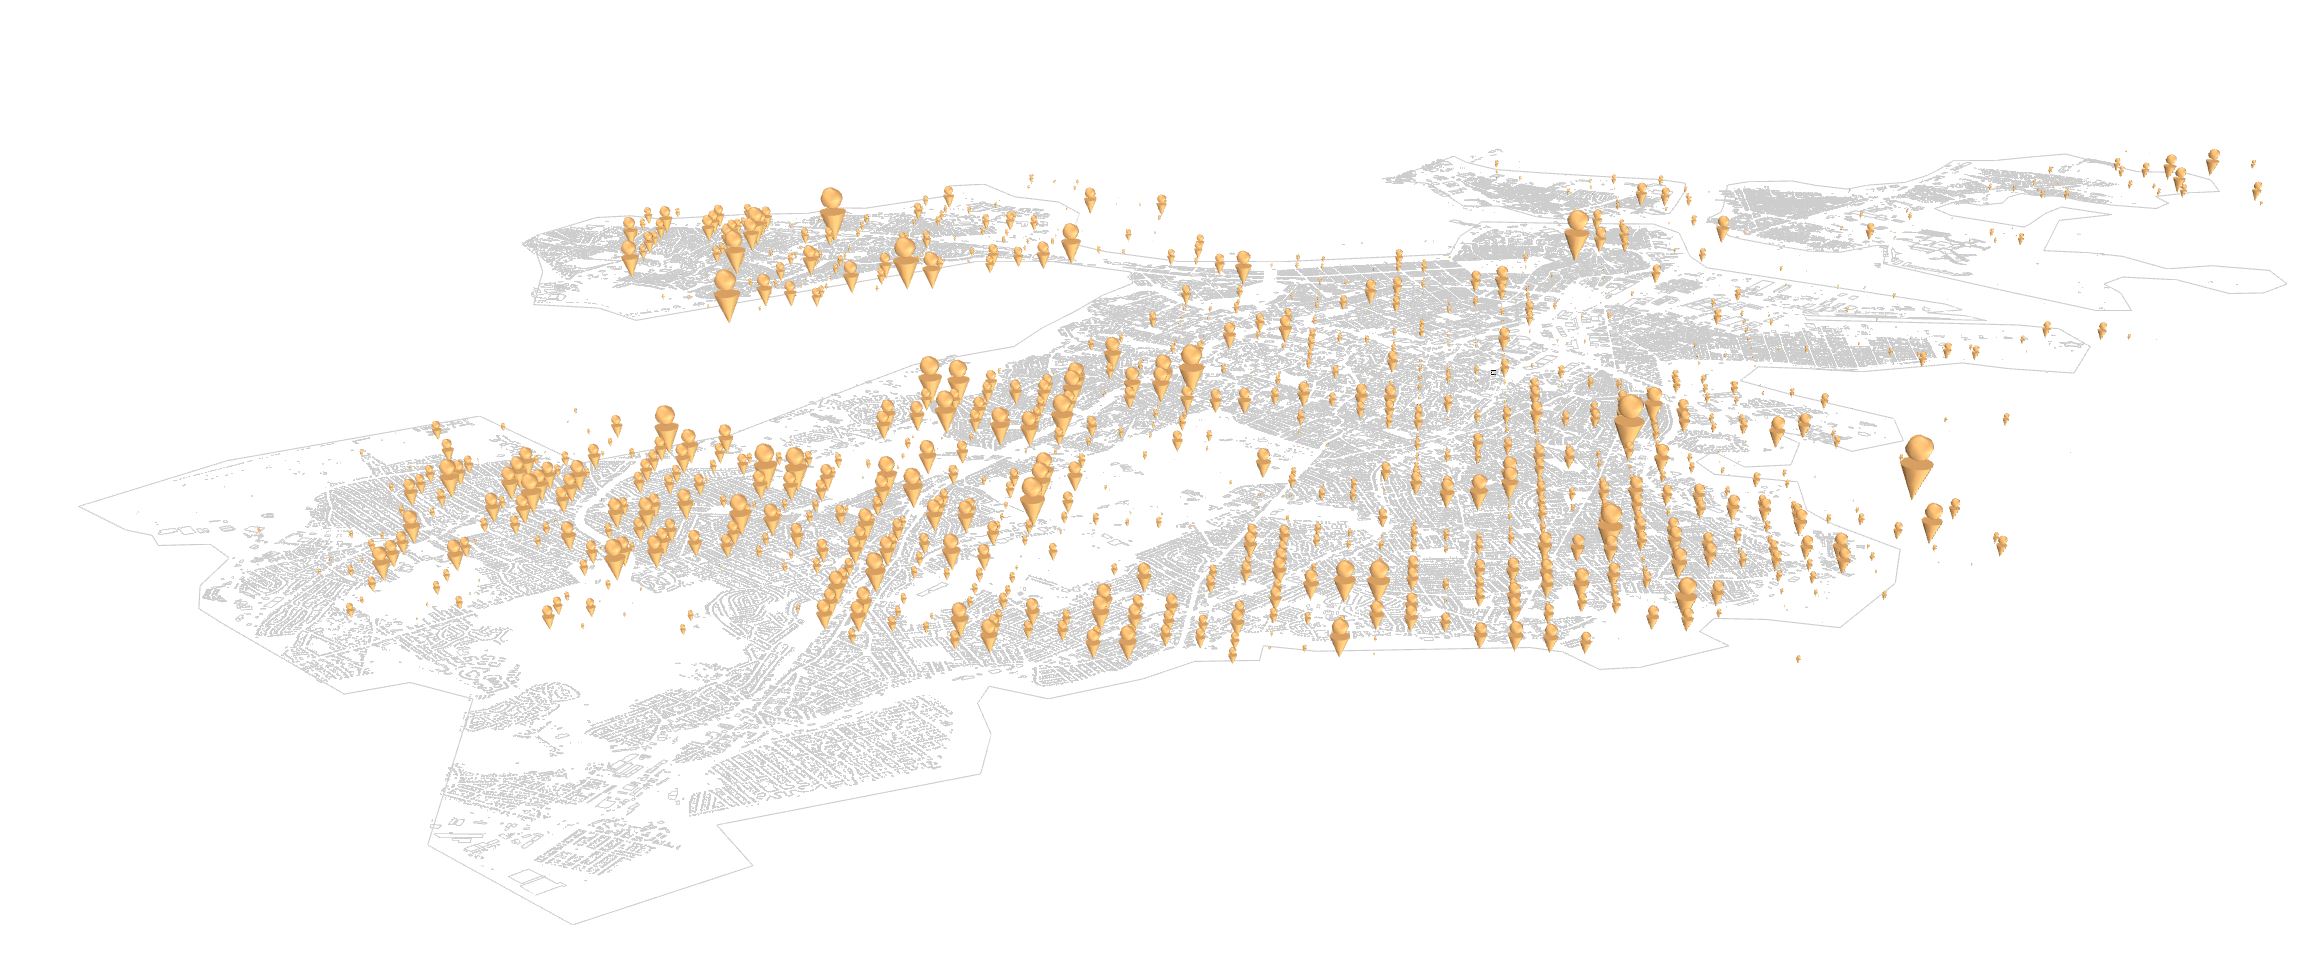
Negative Relationship : Visualized People
Negative Relationship : Visualized Cars
Besides buildings and infrastructures, people and cars were captured by google streetviews assumming where has less urban density. The tendency of such data shows that the different tendency of Craiglist data which is more densely distributed in high values of housing areas. It can be resulted in more engagement in social media is related to housing prices, but less people and cars we can observe from such areas.
Comparisons of Pos and Neg estimators
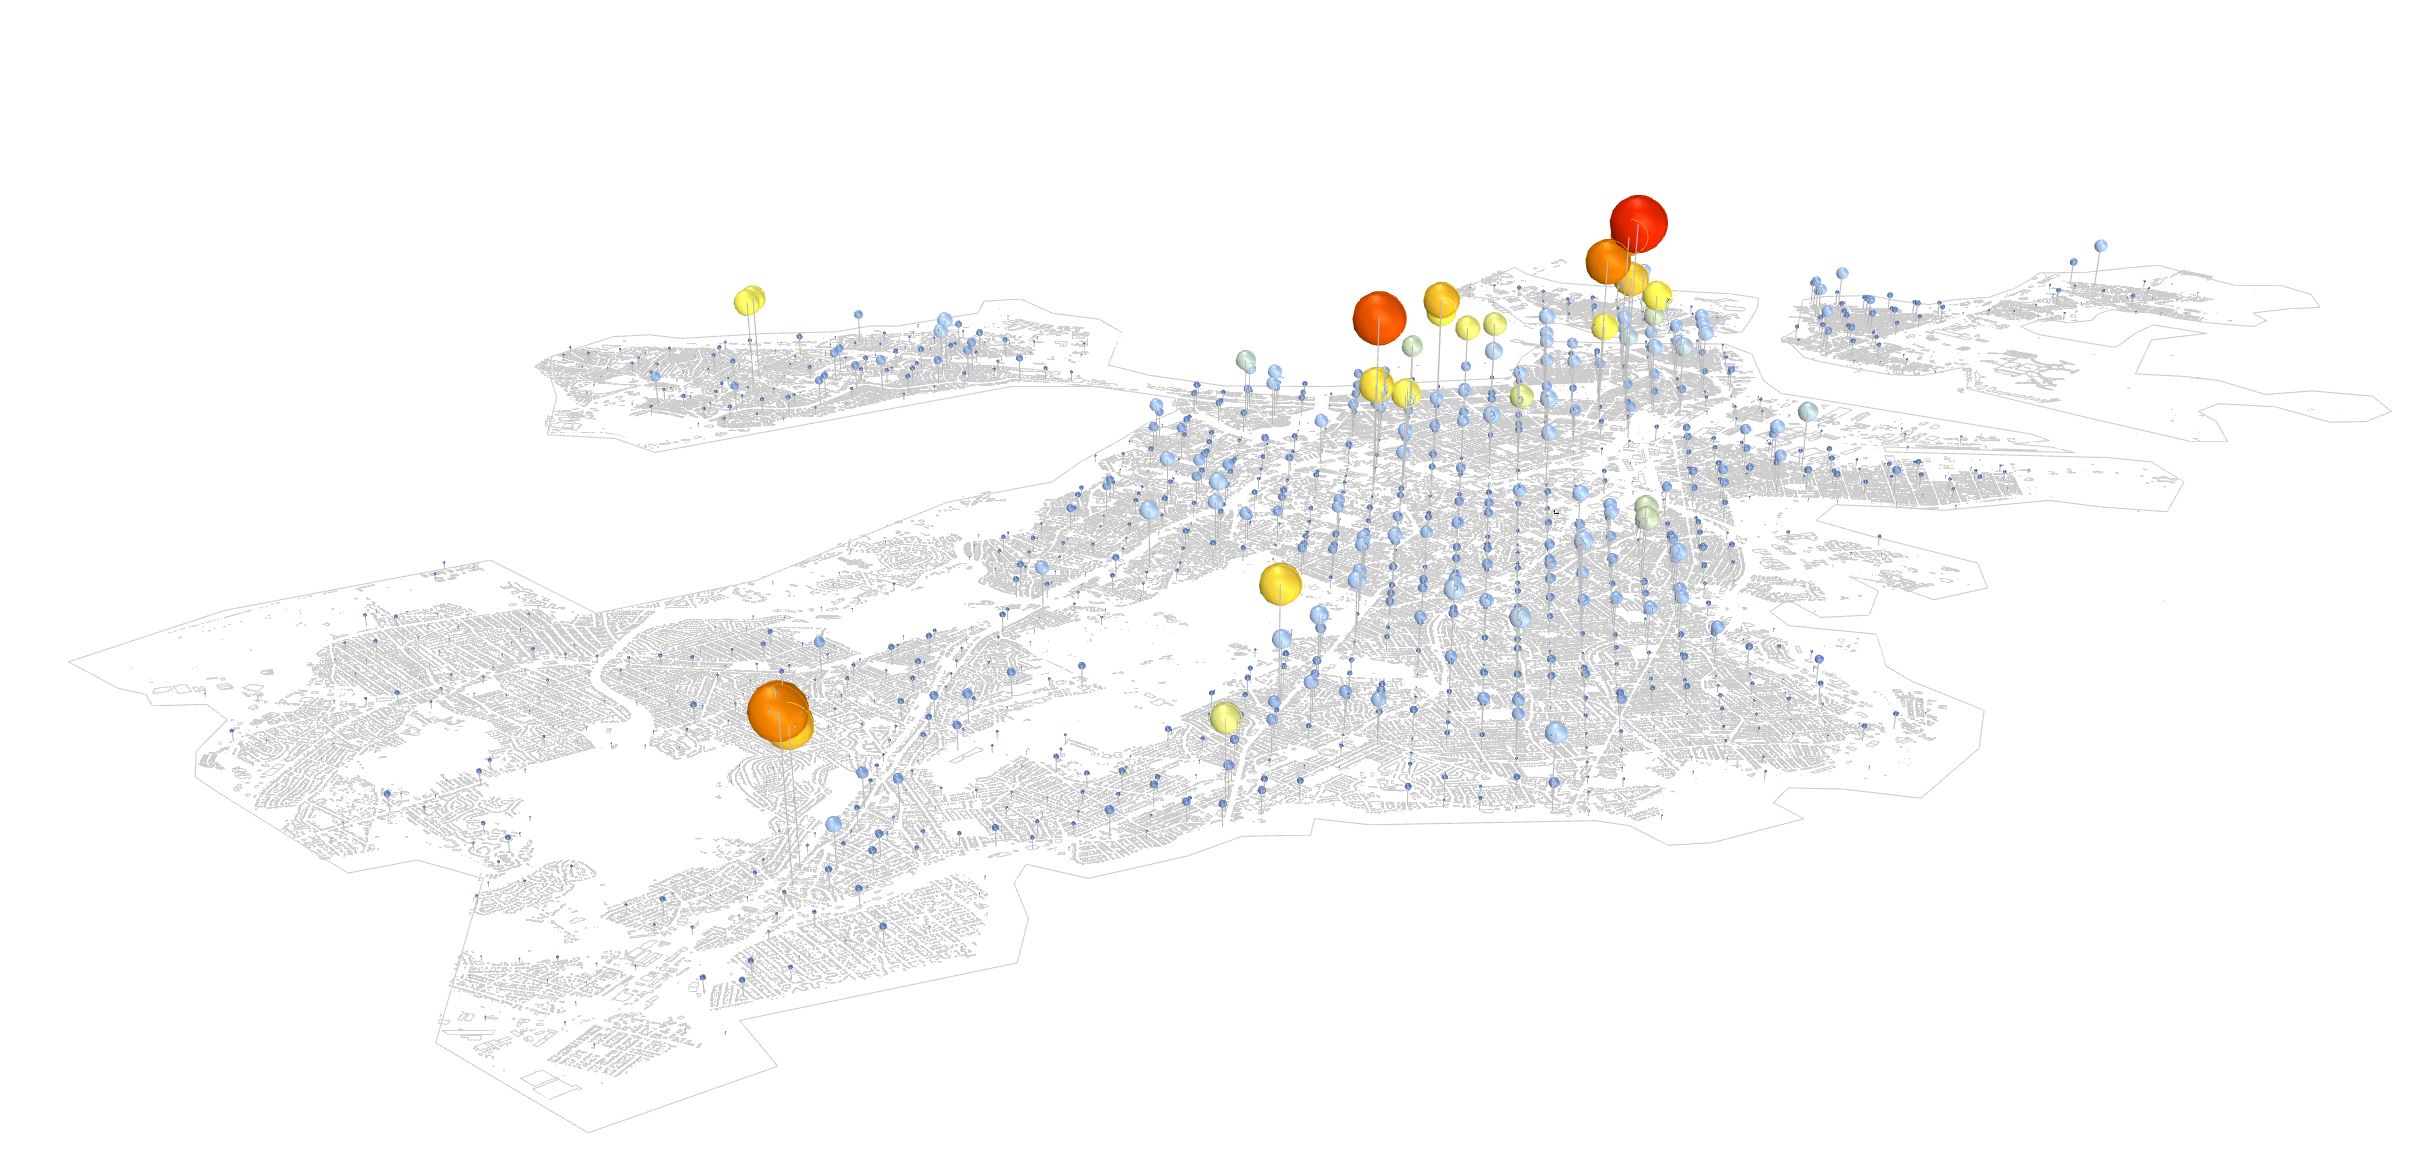
Section 3 : Final Visualization and Interpretation
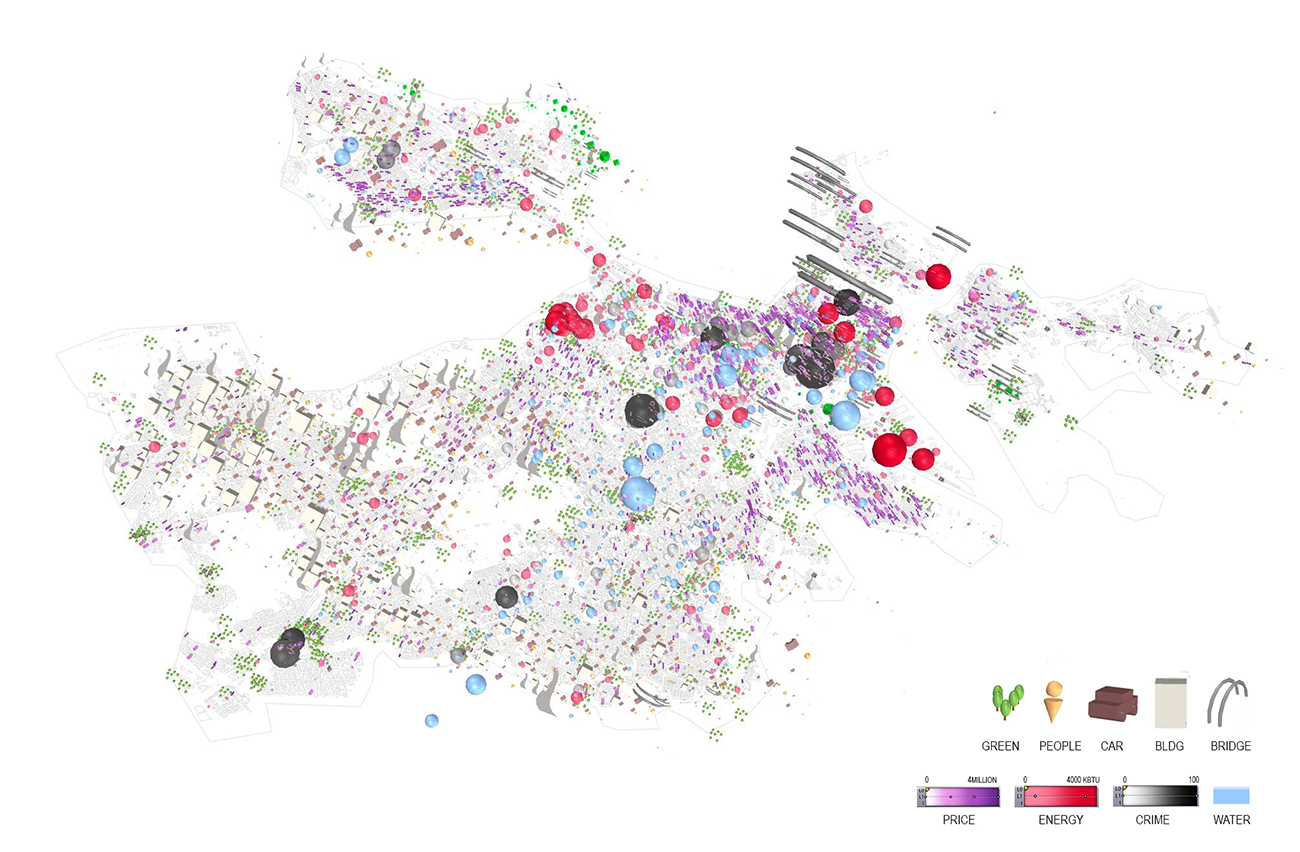
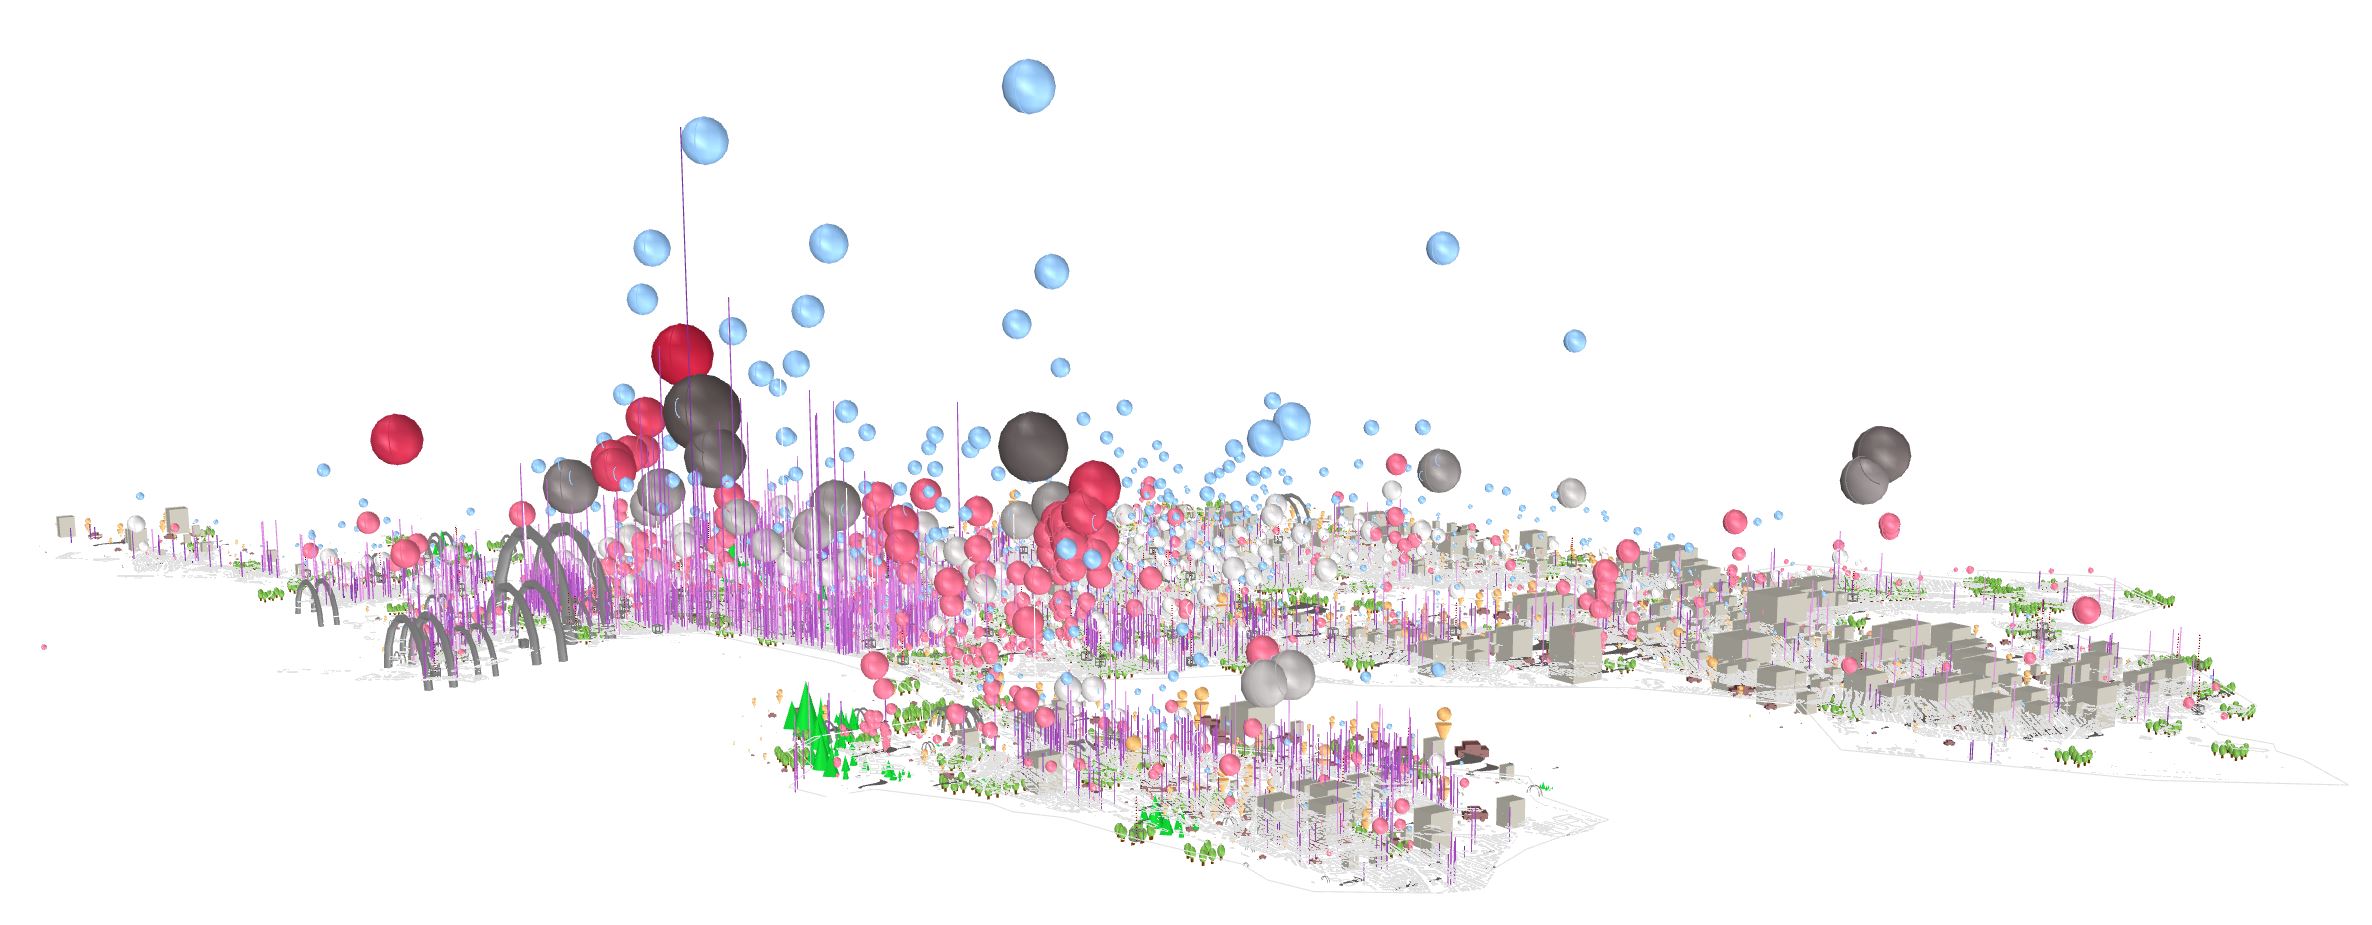
Final visualization model with associated features
In conclusion, intricated urban matrix needs to be organized such an order, but there are multiple factors effecting urban issues including land values and housing prices. From our project, it can be said that decision tree and random forest model predict better to built environment with manifold affecting features. Furthermore, even portion of selected features for each classses shows that the importance of urban condition to estimate property values. Both visual analysis and contextual analysis are crucial to evaluate monetary values for residential units. As you can see the final visualization above, a various range of features could be an estimator to predict housing values. Buildings people, and cars could be the negative estimators, while accesibility to greens, water, and bridges, the use of energy and the rate of crime can possibly indicate positive relation for housing value prediction. Densely packed urban areas sometimes can be categorized with different portion between walls and sky with simple visual analysis. From this project, we learned the potential possibility to analyze certain values based on visually represented data and environment by taking google street views as a method for mathmetical analysis. As a future work, we will apply same models on similar cities to see the performance of suggested model and to improve existing model further.