V1: Action Flows
A visualization of the relative density of interaction among countries, from a set of agent countries to a set of target countries
Agent Countries
Target Countries
V2: Starplot
How Several Major Countries View the World's Superpowers.
United States
Key Patterns
- Small radar graph indicates that America is viewed as less friendly by other countries
- Large radar graph indicates that China has good relations with European countries.
- Similar graphs indicate that Russia and China are quite aligned.
- Japan and US don't seem to view other countries quite nicely.
*The metric is the Goldstein score (seen on axis of Radar chart).
We compute the average Goldstein score of news sent from seven countries to China, United States, and Russia.
Higher scores indicate that countries are aligned.
For country's relationship to itself, we use the mean received from all countries.
V3: Interaction Network
Visualization of density of interaction among countries as a weighted network
Countries
Key Patterns
- Interaction among OECD+ countries centers around the US
- Extremely high interaction between US and UK, and US and China
- Very low degree of interaction between Russia and China.
- Israel shows highest international interaction outside Security Council countries.
*The metric is the product of the bilateral interaction among countries scaled relatively among the interaction products of all the countries in the chosen network.
VX: Reciprocity Map
View bilateral reciprocity of interactions, exploring the balance of agency and receptivity of interaction
Other Visualizations
Nimbly navigate the visualizations below. Click images to explore!
-
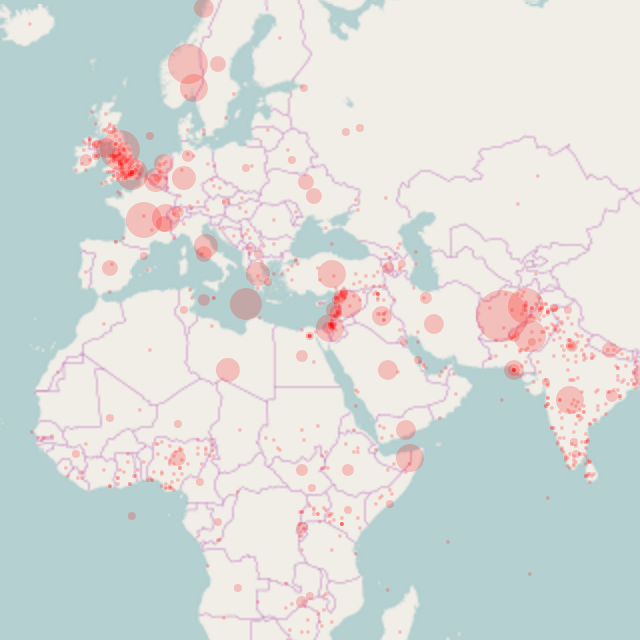
Visualization 4
Events Map
-
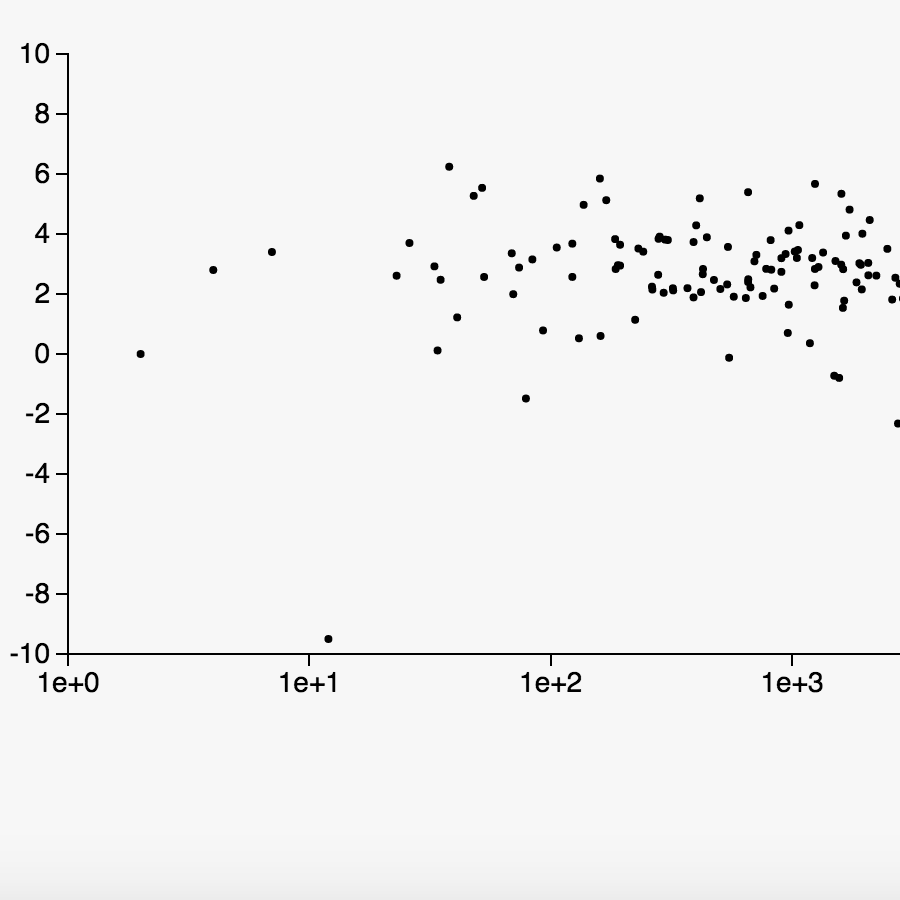
Visualization 5
Scatterplot
-
Conclusion
Credits
CS 171 Visualization / 06472: Visualization (at SEAS) (SCI 0647200)
Harvard John A. Paulson School of Engineering and Applied Sciences
Dimiter Radonov
Harvard College
Sohan Dsouza
Media Lab, MIT
Zihao Wang
Harvard College
NJ Namju Lee
Harvard GSD